Indeed - that is the challenge!
By the way, good delivery >
Thank you! ![]()
Indeed - that is the challenge!
By the way, good delivery >
Thank you! ![]()
OK, so just for clarification, these are the general steps I should take (based on Steve’s posts a couple pages back):
Assuming amplification or normalization will get it to pass ACX Check, proceed with the following:
EQ with LF Rolloff for Speech (using info gathered from the Plot Spectrum - I’m still unclear as to how to get the right number)
EQ again using the 8K Notch Filter if there’s a “whistle” line in my audio at the 8K line in the Spectogram
Apply noise reduction, if needed (Steve used 6,6,3)
Proceed with edits such as cut/paste/delete
Apply limiter (Steve used Soft Limit, -3db limit, 30ms hold)
Is that about right?
Analyze > Plot Spectrum gets bigger and cooler by dragging the window bigger and bigger. Literally. Click the corner of the window on your screen and pull. More of the graphics become available. Also, the detail in the graphic goes up with the “Size” number. Pick Log Frequency because that gives you more detail on the left (low pitched tones).
As you mouse over each peak, the display will tell you where you are.
LF Rolloff for Speech (or whatever we’re calling it now) is a fixed, magic filter. No sliders. It was designed intentionally for voice work. It suppresses much of the room rumble, some P Pops and even power hum both in the US and Europe. All this and having minimal effect on the show sound, almost none at all if you’re a woman.
Do you have it yet? It’s a little bit of an exercise to install a custom filter in Audacity, but well worth it because it can give you a good noise reading bump if your noise is marginal. There is no value in preserving Metrobus rumble in your spoken work.
Koz
When I was playing around with one of my tracks earlier and using Plot Spectrum, I made my dialog box look like Steve’s did in the screenshot; I’m still unclear as to where he found that 125 approximation - as in where, specifically, he put the cursor to get that number.
Do you have it yet? It’s a little bit of an exercise to install a custom filter in Audacity, but well worth it because it can give you a good noise reading bump if your noise is marginal. There is no value in preserving Metrobus rumble in your spoken work.
Yes, I installed/imported the LF Rolloff for Speech before I even registered here, I think. Earlier, I went through Steve’s step by step process on one of my other tracks (mostly using the numbers he plugged in for the sample I’d already uploaded) and the track passes ACX. I just want to make sure I understand what numbers to put in with each track I’m working on because it probably won’t be exactly the same each time. And I wrote down the checklist so I’ll make sure to walk through that each time. Otherwise, I might forget.
One of the other ACX requirements is to sound consistent chapter to chapter. This can conflict with having one chapter in the middle that needs additional processing to pass the robot.
That’s where you may need to get good at spot corrections. Steve went over your post and manually corrected small portions, like that one time you emphasized one or two words a little too much. If that fails, there’s always re-recording one chapter, although most readers would rather open an artery than read works again. Not surprising.
That’s also why passing ACX Compliance with some margin is good. That’s where my sound test falls apart. I passed with no processing, but not by all that much.
in where, specifically, he put the cursor to get that number.
Analyze > Plot Spectrum display is loudness up the left and frequency or tonal pitch left to right. Rumble and metrobusses on the left and bats screaming on the right. If you do this enough you start to get a feel for where everything is. 440 should be somewhere in the middle of the screen if you have Log Frequency selected. That’s the oboe tone at the beginning of an orchestra.
The stuff on the extreme left like 2-10 have names like “Earthquake P Waves” that scare the cat and “S” waves that tip the wineglass over. You can’t always hear those. Those are physical events. 20 is the lowest tone that most people can “hear.” That’s pedal tones on a cathedral organ.
3000 is fingernails on blackboard and babies screaming on jets.
Higher than that you start to get tones that people “hear” by complaining that their ears are getting warm. Dentist drills. That’s also where old people don’t hear squat.
I can’t illustrate this with screen grabs. They keep erasing some of the graphic. Note as you wave your cursor around the Spectrum display, the Cursor and Peak windows keep reading different numbers. That’s how you know. Cursor is wherever your cross happens to be and Peak “sticks” to the highest peaks.
http://manual.audacityteam.org/o/man/analyze_menu.html
Koz
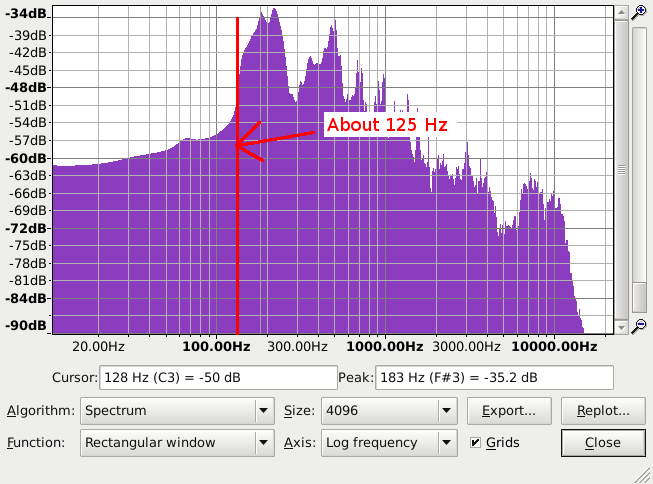
When the cursor is over the spectrum plot, readout in the “Cursor:” text box reads the position on the X-scale (the horizontal “Hz” scale). Anywhere along the red line (approximately) is at about 125 Hz. The “Cursor:” text box in the above image shows 128 Hz. Just a slight movement left or right will show a lower or higher figure.
And just to cover it, LF Rolloff only works as designed with the Equalization Length slider all the way up—8191. If the slider is anywhere else, the effect becomes sloppy.
Koz
So everything to the left of that line at say 125Hz is probably Voice, and everything to the right is… other stuff, and the dB scale is the scale up the left, showing the effectiveness or ‘volume’ of what is being recorded.
Yes/No?
Robert
Other way round. “Stuff” to the left of the line is virtually all low frequency noise and “DC off-set”.
To get the best amount of low frequency (pop and rumble) reduction, yes. In this case there’s not much pop, rumble or low hum to worry about, so a “long filter length” is not really necessary. There is a downside to using a long filter. The longer the filter the better it’s performance in terms of frequency, but the worse it’s response in terms of “time”. A filter with a short length “reacts” more quickly to changes than a long filter length. In my “tutorial” I used the default filter length of 4001.
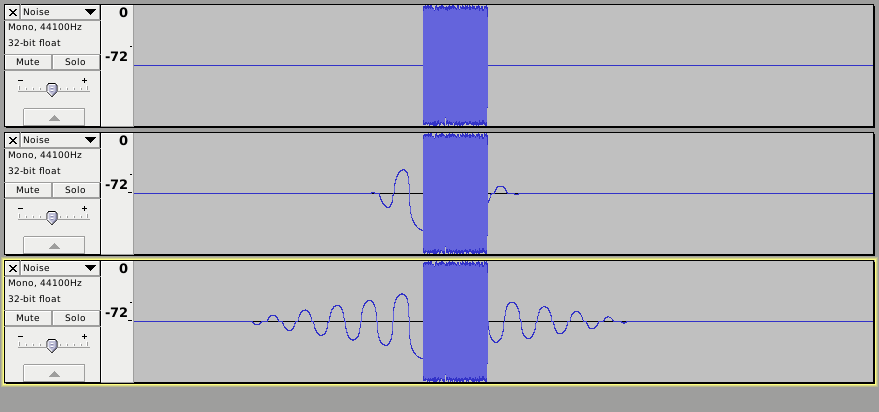
Not important for the original poster, but as an illustration of the “technical” point above. This image uses three tracks that had an identical burst of white noise in each track, The first track is unfiltered, the second track has been filtered with a 100 Hz high-pass filter with a short filter length (about 2000), and the third track filtered with a 100 Hz high-pass filter with a long filter length (8191). The third track shows how the filter “rings” for much longer close to the 100 Hz cut-off frequency. (note that this is an “artificial” test that illustrates a worst-case scenario).
According to the Wikipedia article about voice frequency: “The voiced speech of a typical adult male will have a fundamental frequency from 85 to 180 Hz, and that of a typical adult female from 165 to 255 Hz.” That is, the frequency ranges (of the fundamental frequency) are about an octave apart, for males and females.6 Sep 2013
Ah, I think I see. So on the X axis, between those frequencies, depending on male or female, it will most likely be voice.
Left -and right- of those frequencies will be ‘stuff’, although, other thing could be in there within those frequencies.
@Steve, thanks for that extra bit. On frequency. It’s really informative, I’m learning a lot!
Robert
The frequency ranges given there are for the “fundamental frequency” - that’s the lowest “harmonic” within the sound. There’s a lot of important sound in a voice that goes much higher than that. An old fashion “land line” telephone had a typical frequency range of about 300 Hz to 3000 Hz, which is sufficient for most of the important parts of a voice for understanding what is being said, but with such phones it could often be difficult to distinguish between an “F” sound and an “S” sound. That’s because “F’s” and “S’s” contain frequencies that go well beyond 3000 Hz. The highest frequencies in speech can go beyond 10000 Hz.
Ok, now that first graph on page 3 starts to make sense to me. Interesting. I can now look at my own tracks and make a bit more sense out of them. I may put up a sample myself tomorrow, see how it looks.
Thanks for explaining this so patiently to me.
Robert
I’m going to have to read through these latest posts carefully so I can get a better understanding of the explanations.
Did some recording today. Got so frustrated with the inconsistent pass rates on ACX Check … that darn RMS number. I finally relented and switched mics - put in the AT2035, and played around with it a bit. Despite what looked like a promising start, I’m STILL struggling with getting that RMS number to meet ACX’s criteria. This sort of complication is throwing a major hitch in my schedule. Ugh …
Where’s your last test voice clip? People with thin voices or overly bright microphones have a lot of trouble trying to make all three numbers at once.
Please make a new clip and post it. I widened out the time values in the recommended clip page. You should hit 20 seconds now instead of only 10.
http://www.kozco.com/tech/audacity/TestClip/Record_A_Clip.html
Make sure the instructions say 2016-02-06.
Again, don’t help the file before you post.
Koz
I’ll try again tomorrow and will post a sample then. It’s got to be something I’m doing wrong with my delivery then. Sometimes it’ll pass after normalization and sometimes it won’t. On very rare occasions it’ll pass without anything - but that’s usually because I’m either very, very close to the mic, or I’m speaking in a raised voice that’s unsustainable. And when I listen to those particular clips, the volume of my voice is too overpowering. The sweet spots I’ve found on both mics that give me a good, clear sound without being unbearably loud are also the spots with hit-or-miss pass rates.
This may be the place for gentle compression over all the clips so your RMS (loudness) values wander, but wander inside the two ACX limits. And yes, that was my experience, too. With a straight dynamic microphone and close delivery, the voice density and loudness was just about right, but I don’t know I would be able to keep that up through a book.
And the recommended production process does have you announcing peaks occasionally at -6, but then normalizing later to ACX 3 (or 3.2). So you will always be announcing slightly lower than the delivery. That’s intentional. You are most likely to make mistakes during the live announce and that’s where you have to be careful not to smack 0 on the meters or 100% on the blue waves, the maximum values.
We’ll know more after your test clip.
Koz
I was wondering the same thing about compression. I know that when I used compress dynamics followed by normalize, I always passed ACX check. But that often left me with the problem I started this thread with. So I was hesitant to use it again since I don’t know how to play with the numbers beyond the initial tinkering I did with them after watching a YouTube video about it.
I still hesitate to proceed with the AT2035 though … mostly because like I said, I started out the project with the dynamic, and switching mics will give a different sound than what the author is already familiar with. If I could just get a handle on that RMS number, I could get past this headache. So, so frustrating.