Now I used a file with more than 1000 Hz…
Audacity generates a report in that menu you indicated (Plot Spectrum). I generated, tabulated the information in Excel and compared. In my non-audio expert’s eye, I didn’t spot the 15% pitch increase, but rather that from track to track the decibels in each range on average decreased in value. That’s right?
By these values, can you identify the 15% pitch increase?
You are right, Steve. Track 1 and track 7 are really equal.
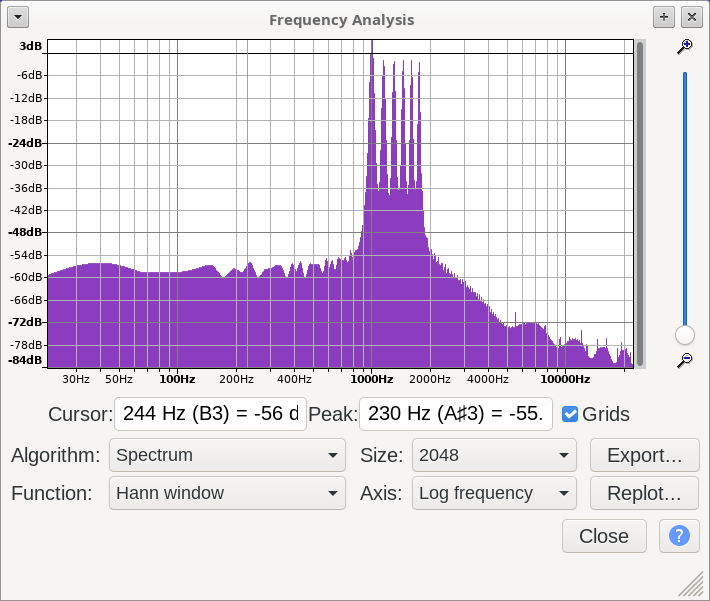
Plot Spectrum with all 7 tracks selected.
Observe the 6 spikes (one per track)
Observe that the first spike is bigger than the others (because it is the sum of the first and last tracks)
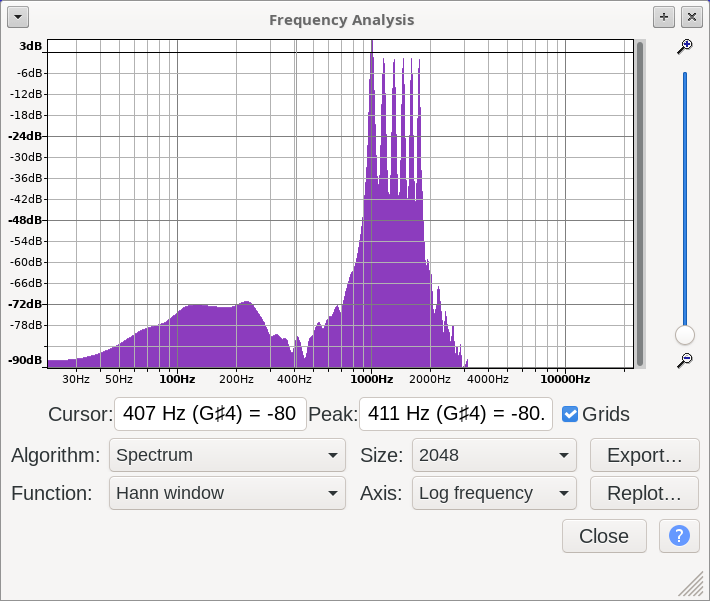
Same thing but with SBSMS enabled.
Observe that there is less “noise” than in the SoundTouch version:
Thanks for all, Steve.
I will use your routine for manipulate my n-tracks…
God bless you!