I promised another question, so here it is.
Is there a way (other than switching from “linear” to “log”) to zoom in on a portion of the spectrum plot? I now export the spectrum and then graph it with LibreOffice Calc. That works, but it’s a bit inconvenient.
I wish. The best I’ve been able to do is expand the display to the right and then push it left – off the screen and keep doing that. The official party line is you don’t need zooming because the cursor tools and management will tell you where the peaks are and their value.
No, I don’t believe it, either. It completely ignores the relationship between the peaks and valleys and the peaks to each other – it’s a right-brain, left brain thing. What time is it [holding up fingers to indicate direction of the hands]?
Most major television control rooms still have an analog clock display because you don’t have to stop what you’re doing and analyze the numbers.
Koz
And on Macs, it’s Control - Scroll-Up. No outside software needed. I want the additional accuracy you get with pulling the analysis window larger… and larger… and larger.
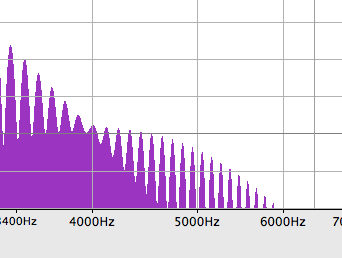
“There’s something going on around 4 KHz and I think it’s interacting with the flutes.” Koz
For increased accuracy, increase the “Size” setting.
The maximum setting is an FFT size of 16384 which provides 8192 frequency bands (roughly one every 3 Hz). That’s getting close to being a forensics tool.
Just by expanding to full screen I can see separate frequencies that are separated by as little as 1/3 tone.
Let’s say that you can zoom in and see that there is not just one spike frequency at 423 Hz, but actually two frequency spikes, one at 422.8 Hz and one at 424.1 Hz. What are you going to do about it? What difference does it make? If you need to cut them then even a really narrow notch filter at 423 Hz will wipe out both of them. If you just want to attenuate them then you’ll probably use the Equalization effect which will affect probably 1/3 of an octave.
You say it’s a right-brain/left-brain thing, but is the right-brain really bothered whether there is a notch at 17243.7 Hz? Is the left-brain concerned about that either (unless analysing frequency absorption through compressed gasses or some other scientific experiment)?
I’m not saying that there is never a need for precise frequency measurement, but it’s about what tool you use for what job. You would probably not expect to find nanosecond markings on a wrist watch, seconds are quite adequate for what a wrist watch is designed for, and some wrist watches don’t even show seconds. “Sorry boss, I was 14.327 seconds late for work today”.
Wiki Feature Requests has votes for “Zoomable/pannable sliders” in Plot Spectrum. Anyone want to vote for that?
Gale