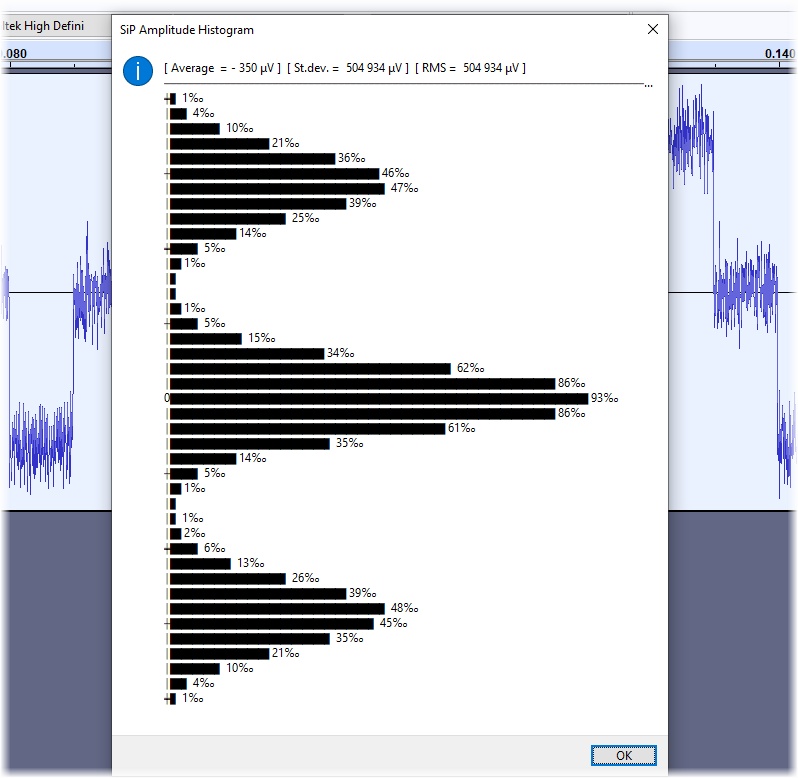
New Plug-In for statistical signal analysis displaying Amplitude histogram as well as DC, St.dev and RMS.
On the preview you can see the result of processing the return-to-zero signal with Gaussian noise that I use for teaching at the Zagreb university of applied sciences…
A very interesting and unique output method
It’s a little bit risky using Unicode as Nyquist itself does not support it, but it worked fine for me.
Also it’s nice to see someone using SAL
Personally I always use the Lisp syntax (SAL didn’t exist when I started learning how to use Nyquist).
One suggestion I would make is to handle the case of long selections (the plug-in crashes if more than 1 million samples are selected). The easiest way to do that would be to use the ;maxlen header (see: https://wiki.audacityteam.org/wiki/Nyquist_Plug-in_Headers#maxlen)