First of all, thank you for your effort: Audacity is an awesome tool, one of the best examples of open source technology.
I was testing my hi-fi (and my ears!) generating several tones with Audacity and I noticed that when creating sine waves @15KHz or more, the wave is pretty distorted if the project sampling rate is set to a standard 44.1KHz. Then I created another project with the maximum sampling rate, and then the generated sine wave is absolutely perfect even at 20KHz or more. The question is: why do I get a distorted sine wave when using a “safe” frequency (that is less than 0.5*sampling frequency as Nyquist-Shannon demonstraded)?
Thank you in advance!
P.S.: This happens on windows and macOS… I don’t think it’s related with version/OS stuff.
The Nyquist rate I learned was 2.6, not 2.0. That gives you a close-to-perfect recoverable audio frequency of 17.9KHz, not 22KHz. The areas above 2.6 get there by tricks and noise, not accuracy.
Video uses 48000 which at 18.5KHz is closer to the ideal. I strongly suspect this is why recording studios uses 98000/24 bit instead of CD quality.
Thank you Koz! However I still think that you need to sample at least at 2x the maximum frequency of the signal to avoid aliasing and data loss (take a look at any article on the web, e.g.https://en.wikipedia.org/wiki/Nyquist–Shannon_sampling_theorem ). So there’s something I don’t understand about this issue
Sounds like you learned it wrong koz.
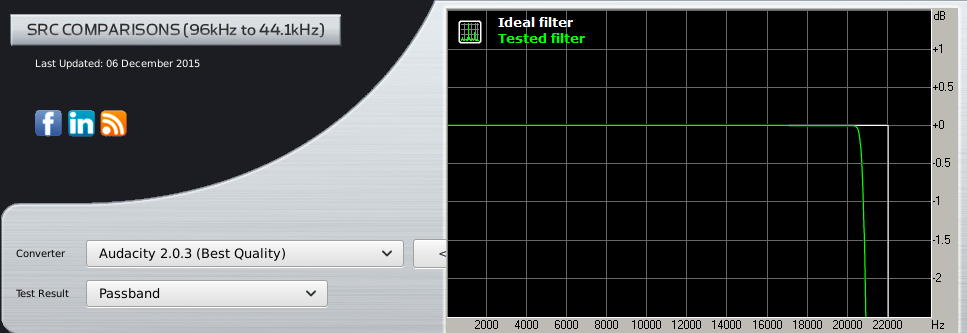
Harry Nyquist and Claude Shannon (among others) proved that band-limited signals below half the sample rate can be reconstructed perfectly. The “2.6 times” limitation has nothing to do with the theorem but is solely a matter of practical implementation of band limiting filters. Even up to the 1990s, it was not possible to achieve sufficient attenuation at the Nyquist frequency without substantial attenuation well below that frequency. Then came digital “Sinc filters” which changed the game by providing vastly superior band limiting.
As can be seen in this image (source: http://src.infinitewave.ca/), recent versions of Audacity have a pass-band that exceeds 20 kHz at a sample rate of 44100 Hz (thanks to the excellent “libsoxr” resampling library).
I assume that you are referring to the visual appearance when you zoom in on the waveform?
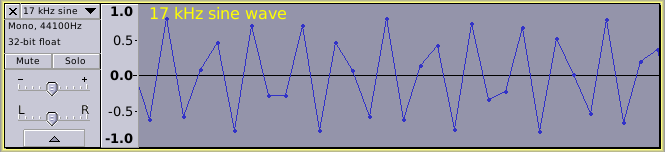
The reason that this “looks” distorted is because the blue line joining the sample values (the line joining the dots), is just simple “linear interpolation” from one sample value to the next. The sample values (the “data”) is still highly accurate, but it is being visually represented as an analog waveform in a very simplified manner. This is not how digital to analog converters work.
According to the Nyquist Shannon theorem, the true analog waveform may be reconstructed perfectly from those dots. Intuitively this seems impossible, but mathematically it is a proven fact, and can be demonstrated:
Generate a 17 kHz tone at a sample rate of 44100 Hz.
Zoom in on the waveform - it looks like trash.
Ask Audacity to reconstruct the waveform at a higher sample rate. (Tracks menu > Resample)
Audacity reconstructs the waveform to show a much smoother waveform.
According to the Nyquist Shannon theorem, there is only one analog waveform that satisfies the two conditions:
The waveform must pass through every point.
All frequency components must be less than half the sample rate.
When Audacity resamples the track to a higher sample rate, it does so by calculating the amplitude values that lie on that one possible line.
Similarly, when a DAC (digital to analog converter) creates an analog output from a stream of PCM digital input samples, it is reconstructing the one possible analog waveform that satisfies the above two conditions.
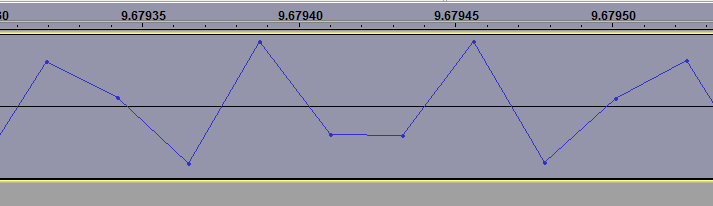
In other words, if Audacity “joined the dots” using sinc interpolation rather than simple linear interpolation, then the drawn waveform would show more accurately the analog waveform that is represented by the dots, and would look like this:
Wow steve you gave me an amazing explanation! Now it’s clear! It’s just the visual rendering of Audacity that it’s not realistic/not equal to what a DAC would do with those samples.