My remarks relate to Audacity version 2.3.3 on Windows 7.
I am missing 3 features in the “Plot Spectrum” analysis tool:
A 10000 Hz grid line for FFTs of sizes 128, 512, 1024, 8192, 16384 & 65536.
For the 1024-FFT grid lines are shown at frequencies 810 Hz and 9400 Hz, which I don’t find useful.
Display of the spectrum of left and right channel in different colours overlaid in the same window for Stereo files instead of the current display of the spectrum of the sum L+R.
Optional manual setting of the axis limits for the vertical (level in dB) and horizontal axes (frequency in Hz).
Additional remark:
The topmost horizontal grid line sometimes (depends on the window size) appears to be marked with the upper limit of the vertical axis. This can be misleading. The annotation for upper and lower limit should be centered to the respective vertical plot borders.
What if multiple tracks are selected? A different color per channel?
Would the colors be customizable or just a fixed series of colors? If customizable, where would the setting be?
I think an option for manual control of the vertical (dB) zoom and limits would be very useful. I fully support this proposal.
I don’t think that the horizontal zoom is as useful as the data being represented is a fixed set based on the FFT analysis. For specialist work where this is really important it is better to export the data and use a more powerful graphing app (such as the very powerful open source app “gnuplot”, or even Microsoft Excel). Nevertheless I think it could be convenient in some cases.
@Trebor:
thank you for making me aware of that plugin !
I’ll check, whether it does what I want.
@steve:
I am only working on Mono and Stereo files. Red & Blue or Red & Green would be ok with me.
For more channels I leave the colour choice to you.
My present application is checking digitized stereo analogue tape recordings. Some tapes are in bad shape and leave parts of their magnetization layer on the playback head which results in high frequency loss, often more pronounced for the left channel than for the right channel in case of 4-track heads.
I need to see the the spectrum displays for left & right channel as separate traces in the same display window to get an impression, whether one of the channel has such a problem.
With the current display of the spectrum of L+R Audacity is useless for this purpose.
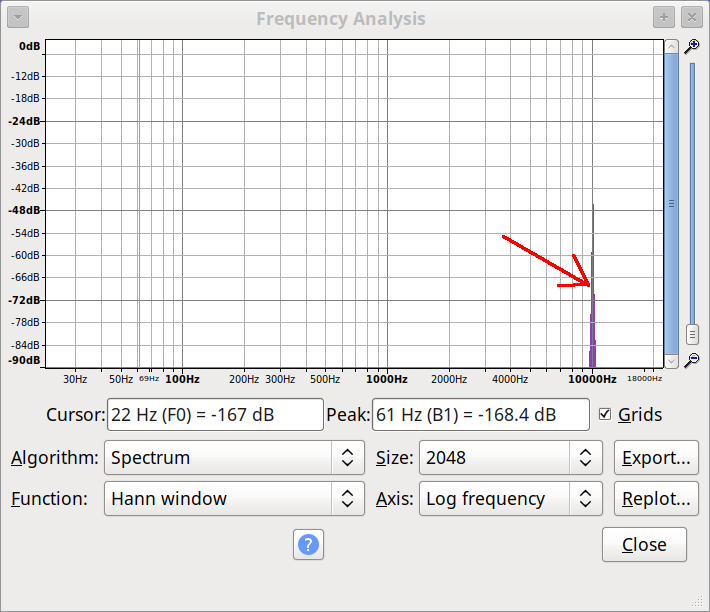
On your spectral image the 10000 Hz grid line is missing. I did not say that there is no 1000 Hz line. In many cases the 10000 Hz line is missing.
Sorry, I forgot one point, as I could not read steve’s post while I was writing.
I would find manual settings for the horizontal axis useful as well, not so much to zoom in, but to avoid display of spectrum values below 20 Hz when I am e.g. using a 16384-FFT on a 48 kSps file to get ~3 Hz resolution in the bass range. Audacity then displays the spectrum down to ~3 Hz, the frequency of the lowest FFT-bin. For normal audio applications you are not interested in frequencies below 20 Hz, so this just wastes horizontal space. Manual settings would allow to set the lower limit at the user’s choice. Sometimes it is useful to apply even a 32768-FFT, but it is rarely useful to see the spectrum down to ~1.5 Hz .
In the meantime I have looked at Voxengo’s SPAN.
My understanding is that this is a tool for real-time FFT analysis of signals coming in from the audio interface.
While I am digitizing tapes, I am using something similar called “AudioAnalyser” by Sebastian Dunst http://softsolutions.sedutec.de/audioanalyser/
When working with Audacity on digital recordings of those tapes, FFTs on selected portions of the file are required, to find which sections are usable and which have to be re-recorded after cleaning the tape recorder’s playback head and tape guide.
SPAN does not seem to be the right tool for this purpose.
@Steve:
The 10000 Hz (ten thousend Hz) line is missing. You are looking at and pointing to the 1000 Hz (thousend Hz) line.
The 10000 Hz line should be 1 decade to the right of the 1000 Hz line.
The graph, however, shows a 9000 Hz line to the right of the annotated 8000 Hz line. Next annotation is at 11000 Hz, next line is at 20000 Hz.
@Trebor:
I like RT when I need it.
In this case I need FFTs of a section of a stereo file loaded into Audacity. This section may be even much longer than the usual block sizes. Audacity handles that up to a certain limit.
By the way, when you are working with old mechanically driven analogue equipment like tape recorders, you sometimes want to look at the value and stability of tape speed. You do this by recording a test tone of e.g. 1000 Hz on a precision recorder (or buy a reference tape with such a tone) and then play that tape on the recorder to be checked.
You may want to have a look at the response around 1000 Hz in a ±10 Hz range with 0.1 Hz resolution. This requires 2^19=524288-FFT on 48 kSps signals (~0.092 Hz resolution) and the ability to zoom into the horizontal axis. So it is actually not really useless to have optional manual limits for the horizontal axis as well.
Yes I know that I’ve set the FFT Size to 2048, but so what? Why is that more than a trivial detail?
The grid resizes dynamically as the window is resized. This has to use compromises so that there is room for the text. If you are not satisfied with Audacity’s (admittedly limited) graphing capability, export the data and use a specialized graphic app (such as gnuplot) or whatever graphing application you prefer.
In my initial post I have listed the FFT-sizes for which the 10000 Hz grid line is missing.
It is not a trivial detail, it is a bug in the programming.
There is no point in showing that the line is there with a FFT size that I did not report.
I do not appreciate such a careless attitude towards deficiencies of the program.
Details like this make up the difference between a toy and a serious/professional solution.
Yes it is a bug. I totally agree about that, and it IS logged on the Audacity bug tracker.
I’ve read back through my posts, and I can see that my responses may have come over as “dismissive”. I apologize for that - initially I misunderstood what you were saying because I misread “10000” for “1000”. Yes of course we would like ALL bugs to be fixed, but as bugs go the issue with the 10 kHz grid line is very easy to work around. I think your point about manual dB zoom level is much more important.