I am analyzing bird calls for a project and I have 0 audio experience. I have to find the length, frequency, and range of a bird call. I have no issue with finding the length, but the frequency and range are more difficult. With the plot spectrum, is the tallest peak of the whole plot the main frequency? Also, is this a good tool to find the range of the call? I was going to subtract the lowest frequency from the highest frequency. Does this make sense to do or is there a better way to find range? Thanks!
Analyze > Plot Spectrum may not be the best tool for this. The plot is volume up and down and pitch left to right. There is no time. So, for example, if you have a peak at 400Hz, you can be sure that a 400Hz tone happened at some time in your selection.
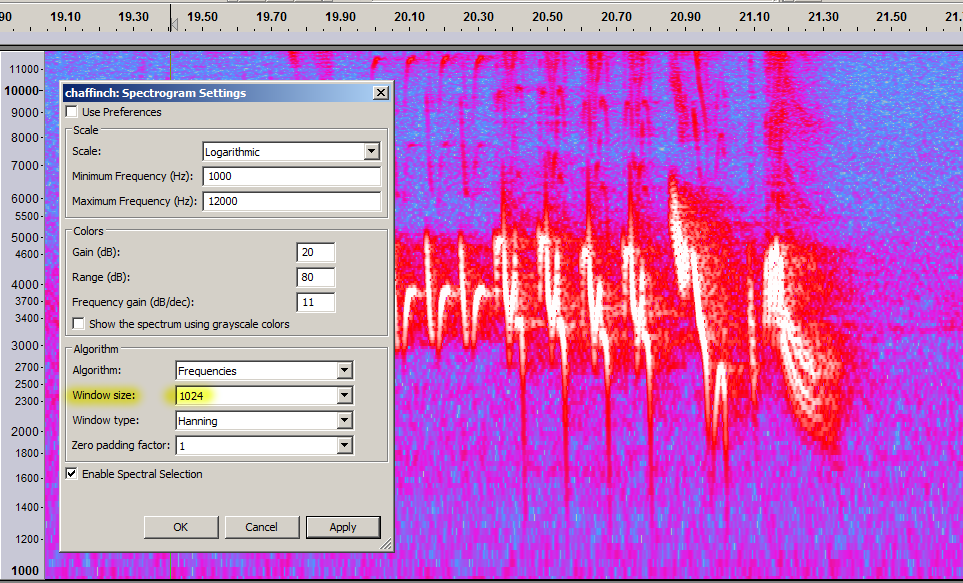
You might like the Left Drop Down > View Spectrogram. That changes the timeline view. It’s Time left and right and Pitch up and down. So now you can tell me when a 400Hz tone happened, but it’s only up to color estimation how loud it is.
Both of those measurements get more accurate and detailed as you pull the windows larger and larger.
If you’ve never had experience with tone or “musical” analysis before, you’re going to have a nasty surprise. Almost all natural sounds have hundreds of other tones in addition to the main one. If you had musical training, those are the overtones and harmonics.

From fuzzy memory, that illustration is piano note “E” somewhere on the keyboard left. All those spikes (tones) to the right of the main one add up to make the piano sound like a piano, and which piano. Same note, different piano will not look the same.
Koz
The Spectrogram is much better, thanks for that! I have a follow up question. For the project I need specific Hz numbers for the frequency and range of frequencies of the call. Would the range of frequencies for this call start at about 250 Hz and end at 1943 Hz as seen in the picture I included?
Also when using the Spectral Selection tool, would the Center Frequency (the black line) be the average of all the frequencies in the selected area?


Spectrogram view is the way to go …

You may have have to increase the Spectrogram “window size” to see sufficient detail.
Would the range of frequencies for this call start at about 250 Hz and end at 1943 Hz as seen in the picture I included?
Why not let your ears tell you as Koz pointed out about all the other harmonics involved with the natural sound of a bird call.
Use the EQ set to flatten and put a lock point on any frequency Hz number and pull straight down on a point to shut off any other frequencies and work your way around.
I’ve never been able to understand much less use the colored spectrum plot graphs.
Just an added note coming from a musician the actual surrounding air and any reverberating echo no matter how slight adds to the nuance of the sound and thus is part of the spectrum. IOW if you’re isolating certain frequencies to eliminate or boost them it can make it sound artificial as if the bird is in a sound proof vacuum chamber.