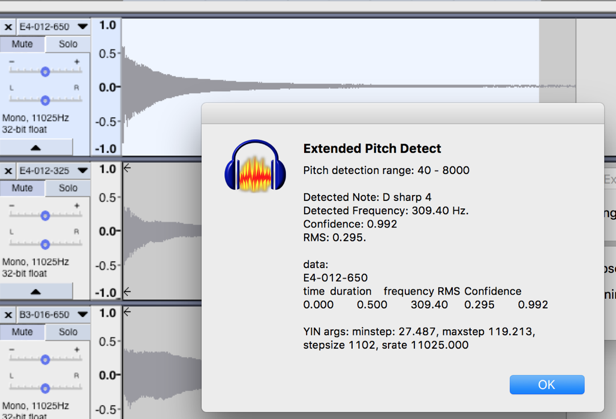
In my Extended Pitch Detect plugin I’m selecting 5s of audio from one track starting at the beginning of the track and the plugin is generating headers and one row of data that looks like this:
time        duration    frequency   RMS         Confidence
0.000       0.500       309.40      0.295       0.992
I’d like to generate 7 more rows of data incrementing the start time by 0.25s with each row.
yin operates on the start of the sound for a specific duration: (yin sound minstep maxstep stepsize)
One way to step through a sound in blocks, is to grab a section of the sound as an array, and then convert the array back into a sound for analysis (or analyze the array directly if appropriate).
Here’s a simple example that grabs blocks of 1000 samples and performs very simple analysis (prints the peak level), then steps through to the next 1000 samples, and so on.
I’ve adapted it with some of my code and your pitch-detect YIN code to create a table and am having trouble getting YIN to produce correct results.
Here’s a screenshot of a pluck of a high E string and the report generated by my Extended Pitch Detect plugin. The track’s about 5s. The fundamental frequency under testing tension is about 309 Hz.
When I run my adapted code which generates a table YIN reports the fundamental frequency is around 62 Hz.
I’m pretty sure the do loop is iterating properly because the reported RMS values trend down in just the way I expect.
Am wondering if YIN needs more than the sound I’m generating and binding to audio-block …
Maybe something I’ve got wrong because I’m just learning lisp … confused a bit about differences between setq and setf …
Here’s what the table code generates – intended to duplicate what I am doing manually now by adjusting the selection and running the Extended Pitch Detect plugin. The sample window is 0.5 s and it is moved forward 0.25 s with every iteration.
The size of step varies a bit because I’m correcting for integer rounding errors when determining the size of the the array of sound values.
sample-index represents the sequence position of the first sample of audio-block represented as it’s position in the original sound in track.
Always use SETF (it does everything that SETQ does and more)
Use SETQ for setting simple numeric values, and use SETF for everything else.
I think that historically SETQ came first. It is just a shorthand way of writing (set (quote variable) value)
The QUOTE function, which may be written as a single quote character, tells Lisp not to evaluate the variable.
These assignments are just different ways of writing the same thing:
The SETF command is more powerful, and will allow other types of assignments, such as setting the value of an element in an array:
(setf ar (make-array 3))
(setf (aref ar 1) "My String Value")
(print ar)  ;returns "My String Value"
Which prints to the debug window:
#(NIL "My String Value" NIL)
We could use (setq ar (make-array 3))
but (setq (aref ar 1) "My String Value) will fail because (aref ar index) is a function and not a simple “symbol”. SETQ can only be used with symbols (simple variables).
For looking up things about XLISP, the XLISP manual is more detailed than the Nyquist manual, and provides examples for most functions.
The XLISP manual is here: XLisp
Regarding the bigger question, I’ll need to spend some time with your code, which I don’t have time to do right now.
Can you narrow down the problem by writing short test scripts for each of your functions?
The most obvious bug I fixed was to remember to use step-to-hz before reporting the frequency value!
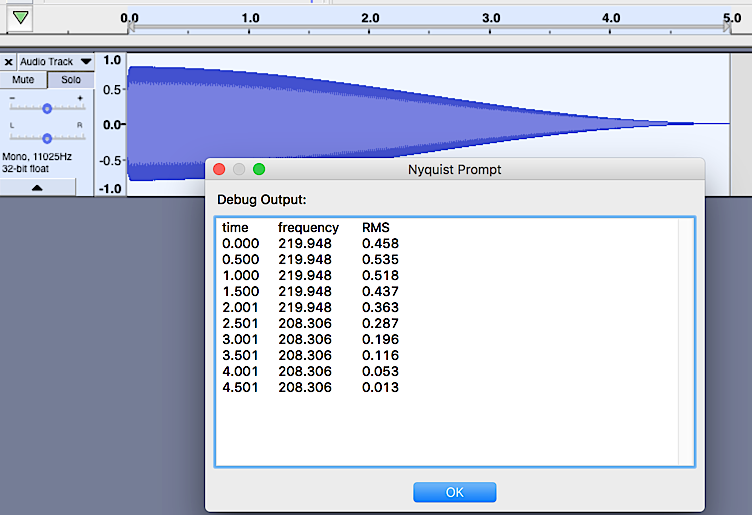
But there is still a more subtle problem. I made a simpler implementation to generate a table of frequency estimations which can be run in the Nyquist Prompt. It shifts the sample window over approximately 0.5s on every iteration and asks YIN to calculate frequency on a 0.1s slice.
First however I used some plugins to generate a simple waveform that descends in pitch and amplitude from A3 to G2. I’ll use this as a reference waveform to test the implementation.
Generate Tone: 220 Hz, 0.8 amplitude for 5s
Sliding Time Scale/Pitch Shift: final pitch shift: -2 semitones
Adjustable Fade: S-Curve Out
A screenshot of the results:
Here’s the code which is running in the Nyquist Prompt:
;; Initializations
(setq time 0.0)
(setq window-time 0.5)
(setq window-length (+ 1 (round (* window-time *sound-srate*))))
(setq f0 nil)       ; initialise detected frequency
(setq confidence 1) ; initialise confidence
(setq *float-format* "%1.3f")

(setf sndcopy (snd-copy *track*))

(psetq min-hz 40 max-hz 8000)

;; Set range in steps (MIDI note numbers)
(psetq minstep (hz-to-step min-hz)
       maxstep (hz-to-step max-hz))

;;; Apply YIN to first DUR seconds
(defun getyin (sig dur)
  (let ((srate (min *sound-srate* (* 8 max-hz))))
    (if (< srate *sound-srate*)
        (progn
          (setf sig
            (if (arrayp sig)
                (sum
                  (extract-abs 0 dur (force-srate srate (aref sig 0)))
                  (extract-abs 0 dur (force-srate srate (aref sig 1))))
                (extract-abs 0 dur (force-srate srate sig))))
          (setq srate (snd-srate sig)))
        (setf sig
          (if (arrayp sig)
              (sum
                (extract-abs 0 dur (aref sig 0))
                (extract-abs 0 dur (aref sig 1)))
              (extract-abs 0 dur sig))))
    (let ((stepsize (truncate  (/ (* 4 srate) min-hz))))
      (yin sig minstep maxstep stepsize))))

;;; Find most confident frequency
(defun bestguess (yin-out)
  (do ((step (snd-fetch (aref yin-out 0))(snd-fetch (aref yin-out 0)))
       (conf (snd-fetch (aref yin-out 1))(snd-fetch (aref yin-out 1))))
      ((not step))
    (when (and (= conf conf)  ; protect against nan
               (< conf confidence))
      (setq confidence conf)
      (setq f0 step)))
  f0)

(defun generate-frequency-table ()
  (format t "~a\t\t~a\t~a~%" "time" "frequency" "RMS")
  (do ((ar (snd-fetch-array sndcopy window-length window-length)
        (snd-fetch-array sndcopy window-length window-length)))
      ((not ar) "Results in debug log")
    (setf audio-block (snd-from-array 0 *sound-srate* ar))
    (format t "~a\t~a\t\t~a~%"
      time
      (step-to-hz (bestguess (getyin audio-block 0.1)))
      (snd-fetch (rms audio-block)))
    (setq time (+ time (/ window-length *sound-srate*)))))

(generate-frequency-table)
Here’s a table of the results with one extra column on the right that shows the frequency estimations individually calculated:
The RMS value is dropping each time through the loop – so the audio being processed each time through the loop appears to correctly represent 0.5s slices of the original sound.
I suspect some subtle problem in the functions getyin or bestguess … ??
The problem was the global variable confidence used to represent the best confidence value in the function bestguess needs to be reset to 1 every time bestguess is called.
Here’s the updated bestguess function:
;;; Find most confident frequency
(defun bestguess (yin-out)
  (setq confidence 1)
  (do ((step (snd-fetch (aref yin-out 0))(snd-fetch (aref yin-out 0)))
       (conf (snd-fetch (aref yin-out 1))(snd-fetch (aref yin-out 1))))
      ((not step))
    (when (and (= conf conf)  ; protect against nan
               (< conf confidence))
      (setq confidence conf)
      (setq f0 step)))
  f0)
You beat me to it. I was about to give you a cryptic clue: “you’re getting too confident”
You have discovered why it is so often said that “globals are bad / evil” (not that they are - you just have to be very careful when and where you use them).
Hello: I just tried your “updated” example on a file of mine with 5 mandolin notes recorded. The out I received was:
Nyquist !
%1.3f
I’d love to be able to get the frequencies and the time durations, as shown in your table.
Any suggestions?
Jim
Thanks for the reply.
When I input the file, Audacity says: Mono, 44100Hz, 32-bit float
Steve: Your code works on the file, but it only gets the 1st note. It’s very accurate. If I create a new file with the 1st note removed, your code works on that as well.
Please post the full code that you are using.
When posting, use the “code tags” from the “</>” button around the code like this:
[co****de]
code goes here [/co****de]
When you run the code in the Nyquist prompt, click the “Debug” button rather than the “OK” button.
After the code has run, the debug window will open. Copy the contents of the debug window and include it (in “code” tags) in your reply.
Thanks!! Both files are mono.
Got it. Had to run it using the Nyquist prompt. I was running it from the Analyze tab.
Is there an ‘easy’ way to save the output to a file?
I got the output window to show on both my test files. I noticed that the output shows frequencies in 0.5 sec intervals. What do I change to get frequencies to show in smaller intervals, as 0.1 sec? Does it have something to do with the "dur’ variable?
Thanks in advance.