Hey there,
This might be the incorrect forum in general but I figured I’d give it a shot. I’m using NAudio and WASAPI to do some c# loopbacking with my sound card.
I’ve got LEDs with a controller via USB and want to set it up to visually display my sound.
I am not 100% sure what the code does exactly - but here is a little snippet:
BitConverter.ToInt32(e.Buffer, 0)
Basically an object of e has a buffer of bytes that I convert to an int. It seems to be a value range of -2000000000 to +2000000000 (I’m very rough guessing here).
I took the code verbatim from an example that wrote to a .wav file and instead of writing the bytes to the file it converted that range to a value from 0-255 (for my RGB lights) and converted it.
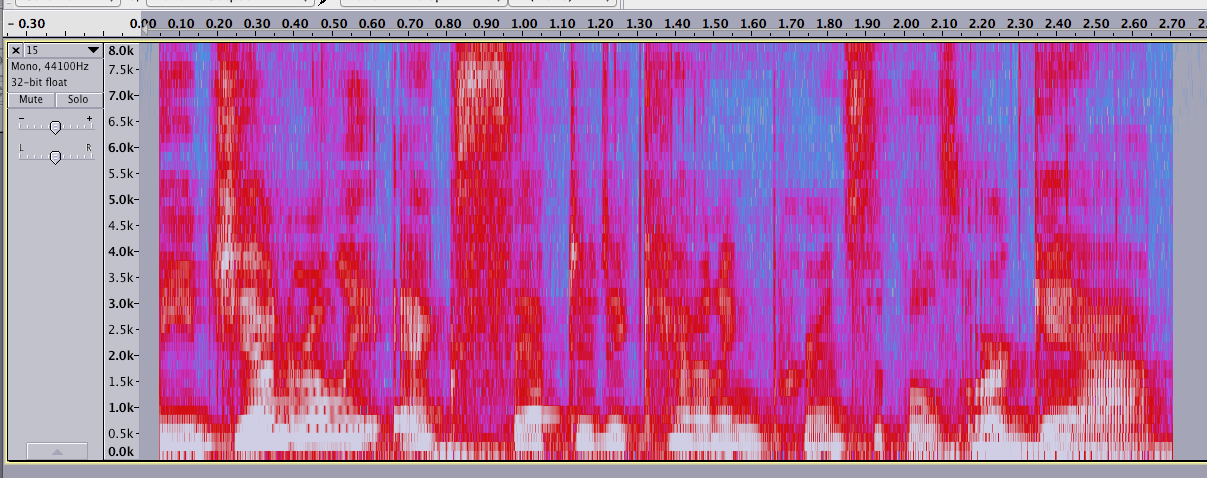
I guess my question is, once I get this range of -20…+20… is there a fun way to visualize it as RGB?
Right now I basically say if the range is -200…-075 then edit red value, if -075…+075…edit blue value, and green.
It just kind of shows up as purple (like, every color is just average).
It’s bland.
Any ideas?
Thanks,
WB
